- Display
storage in Bytes, Words or Double-Words.
- Disply LDT entries.
- List, Symbols, Maps and Symbol Groups
- Display Module Table Entries and Object
Tables
- Display Arena Records for storage dumped.
- Display Object Records for storage dumped.
- Display Information on Dumped Memory.
Note:
This command does not perform the same function as the similarly named Kernel Debugger .ML command, which formats VM Alias Records.
- Display threads.
Note:
Unlike the Dump Formatter and Kernel Debugger version of this command, .P is used to select the thread ordinal within the dumped process. Thus for single thread processes .P 1 is the only valid combination.
- Display thread Block IDs.
Note:
Unlike the Dump Formatter and Kernel Debugger version of this command, .PB is used to select the thread ordinal within the dumped process. Thus for single thread processes .PB 1 is the only valid combination.
- Display registers for each thread.
- Set default thread slot.
Note:
Unlike the Dump Formatter and Kernel Debugger version of this command, .S is used to select the thread ordinal within the dumped process. Thus for single thread processes .S 1 is the only valid combination.
- Load and Unload Symbol files
- Syntax help for internal commands
- Syntax help for external (dot) commands.
Note:
Except where noted above, the command set for the Process Dump Formatter does not support any of the optional parameters supported by their equivalent Kernel Debugger commands.
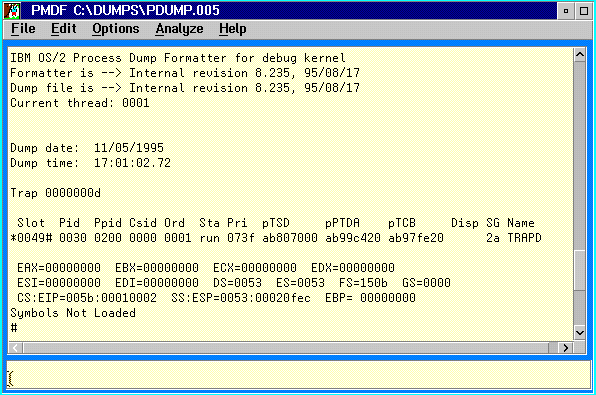
When a Process Dump is loaded PMDF displays the following screen:
Note:
The data and time of the dump are displayed.
If the dump was created because of a trap then the trap number is displayed otherwise the trap number is shown as ffffffff.
The current thread slot and register are shown last.
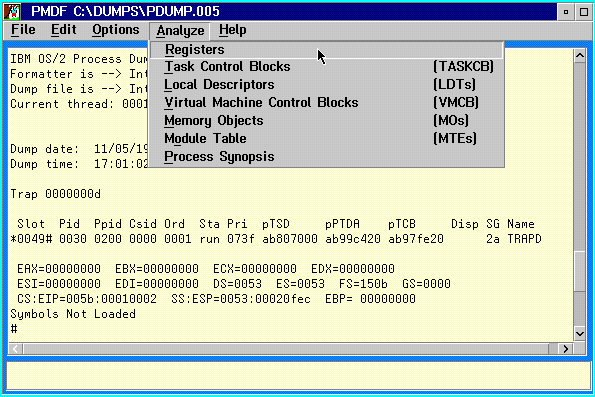
The Analyze pull-down menu differs from the standard PMDF Analyze facility. This offers the following choices:
Registers
- This performs the R command for
each thread dumped.
- This
performs a .P command followed by an R command for each thread
dumped.
- This
performs a DL command.
- This performs a .MA and .MO command.
- This is a
much more extensive version of the .LMO command. The entire MTE and
SMTE for each module dumped is formatted.
- This formats the entire Process Dump,
including dumping all memory in Byte format.
The Analyze option menu appears as follows:
For information on taking and controlling Process Dumps see:
The CONFIG.SYS DUMPPROCESS command.
The DosProcessDump API.
[Back: The TEMPLATE EXEC]
[Next: Kernel Debugger and Dump Formatter Command Reference]