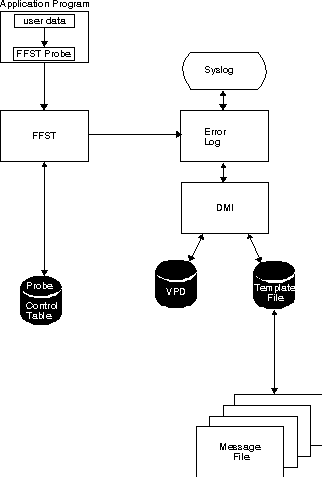
The sequence of events that are shown in FFST Flow shows how FFST logs errors and captures data when your code calls FFSTProbe.
After you develop and install your code on the system, the application program box that is shown in the diagram above signifies your code. The FFSTProbe API is called when your code discovers a problem. If you specify to capture user data in the call to FFSTProbe, the system captures the data with the other error-related information.
Your code calls FFSTProbe to gather the following product information:
After FFST gathers the error-related information, it stores the data as an error log entry. The system stores FFST dump information in a file named FFxxxxxx.DMP, where xxxxxx signifies a six-digit identifier. If a trace snapshot is requested, a file named FFxxxxxx.TRC will be created. If a process dump is requested, a file named FFxxxxxx.PRC will be created. The error log information contains the name of the FFST dump file along with the trace file if applicable.
Use the SYSLOG utility to view the error log information. SYSLOG uses message files and template files to format and display error log records. Use SYSLOG to control the following log functions: